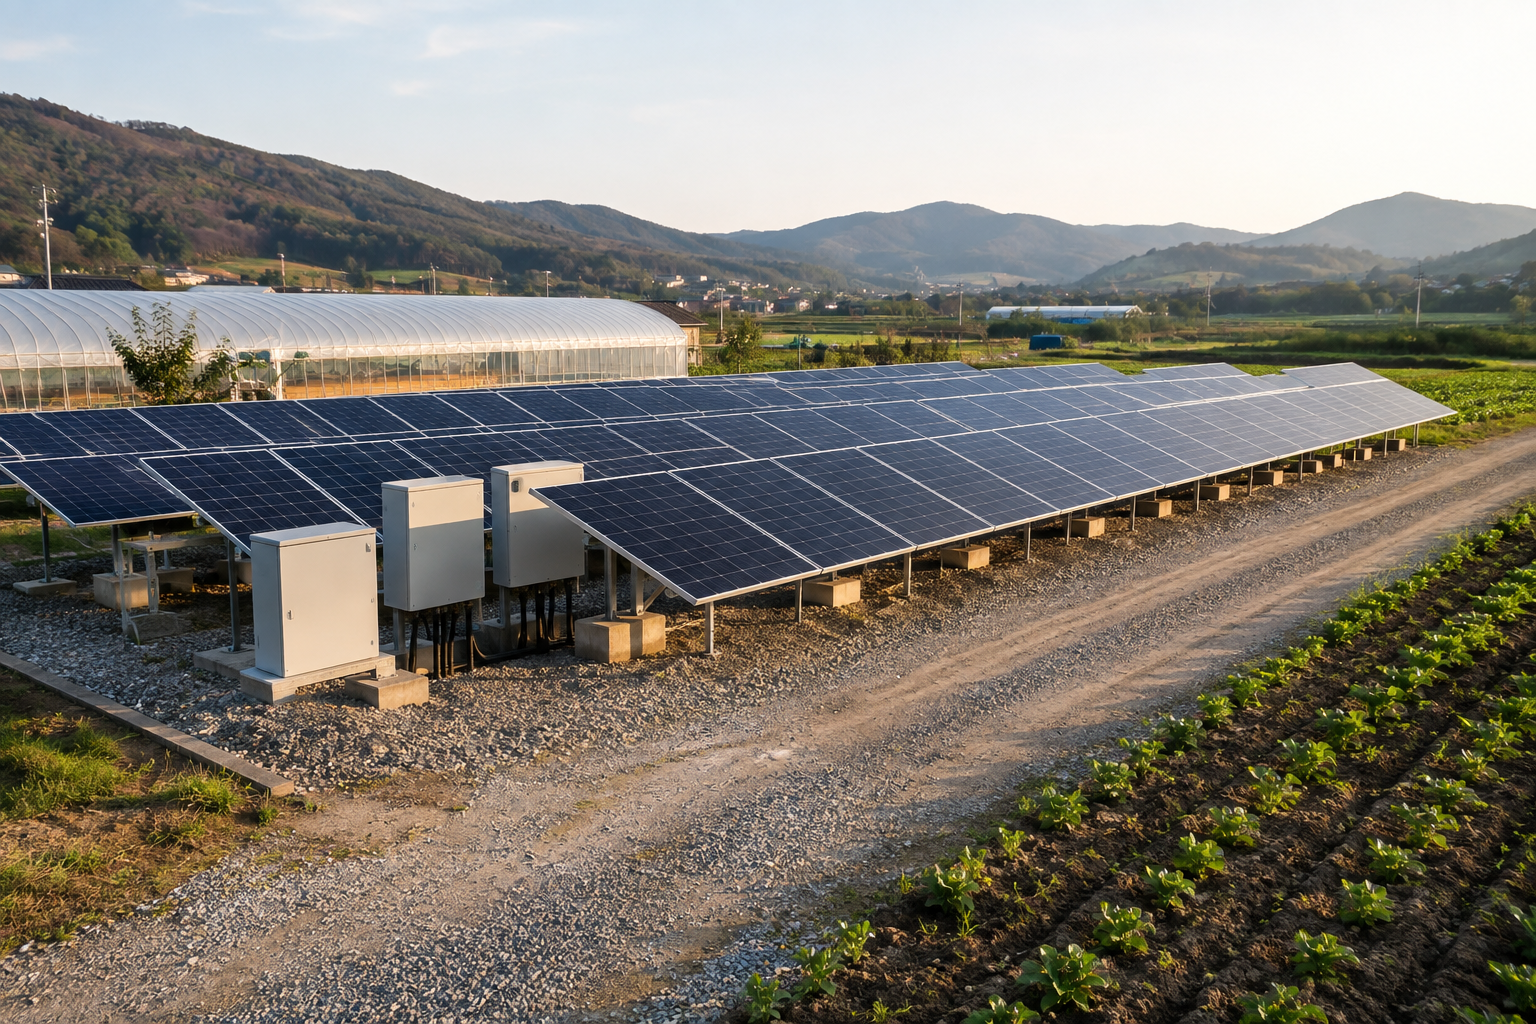
A practical 100kW solar profitability calculation using September 2026 SMP, REC spot settlement data, construction cost scenarios, O&M, and payback period.
Solar Profitability in Sep 2026: SMP, REC, and Construction Costs
Farmers considering a solar project usually hear the same lines first. “A 100kW system brings in this much per month.” “SMP is high these days, so the numbers work.” “Add REC revenue, and it is still worth it.”
Those statements can be partly true. But they are not enough. Solar revenue is not only SMP and REC. Construction cost, grid connection, O&M, insurance, loans, taxes, and land cost all change the final cash flow. One wrong assumption can stretch the payback period quickly.
As of September 3, 2026, the Korea Renewable Energy One-Stop portal displayed a mainland SMP average of 162.74 KRW/kWh. It also displayed a September 2026 mainland REC spot settlement average of 70,752 KRW/REC. Using those figures for a 100kW project, the current-rate calculation gives about 2.53 million KRW in monthly gross revenue and about 2.24 million KRW in monthly operating profit after basic O&M.
This is before loan repayment, taxes, land rent, and grid-connection delays. So it should be read as a business-review number, not as cash that automatically lands in the farmer’s bank account.
1. Calculation assumptions
This article uses a 100kW solar plant as the base case. It is a common size for small rural solar projects.
| Item | Assumption | Note |
|---|---|---|
| Capacity | 100kW | Small power business scale |
| Annual generation | 130,000kWh | 1,300kWh per kW-year |
| Monthly average generation | about 10,833kWh | Annual output divided by 12 |
| SMP | 162.74 KRW/kWh | Mainland average shown on Sep. 3, 2026 |
| REC | 70,752 KRW/REC | Sep. 2026 mainland average shown on portal |
| REC weight | 1.0 | Base calculation; actual weight depends on site and facility conditions |
| Annual O&M | 3.5M KRW | Inspection, insurance, communications, small expenses |
Actual generation depends on region, direction, tilt, shading, panel soiling, inverter performance, snow, faults, and construction quality. A clean south-facing site can produce more. A site with mountain shadows or utility-pole shadows can produce less. Solar is still a field that grows sunlight. Even one line of shade can reduce the harvest.
2. Monthly revenue using September 2026 rates
Using the displayed September rates:
Annual generation = 100kW × 1,300kWh = 130,000kWh
SMP revenue = 130,000kWh × 162.74 KRW = 21,156,200 KRW
REC revenue = 130REC × 70,752 KRW × 1.0 = 9,197,760 KRW
Annual gross revenue = 30,353,960 KRW
Monthly gross revenue = about 2,529,000 KRW
After subtracting 3.5 million KRW in annual O&M:
Annual operating profit = 30,353,960 KRW - 3,500,000 KRW = 26,853,960 KRW
Monthly operating profit = about 2,238,000 KRW
The current-rate number looks attractive. But saying “it leaves 2.2 million KRW per month” is incomplete. Loan repayment, tax, land rent, grid connection cost, and permitting delays are not included yet.
3. Payback changes when construction cost is included
Construction cost for a 100kW solar project varies widely. A simple flat site with nearby electrical connection can be cheaper. A site that needs civil work, fencing, drainage, access-road work, grid reinforcement, or special structures can cost more.
This article uses three total investment levels.
| Total investment | Meaning | Payback at current rates |
|---|---|---|
| 160M KRW | Relatively simple site with limited extra work | about 6.0 years |
| 180M KRW | General review benchmark | about 6.7 years |
| 220M KRW | Heavy civil/grid/site cost burden | about 8.3 years |
The formula is simple.
Simple payback = total investment ÷ annual operating profit
Because current SMP is high, payback looks short. But SMP and REC are not fixed prices. They move with the power market, fuel prices, grid conditions, and REC supply and demand. So large-investment projects should not be judged from one spot-rate snapshot.
4. Conservative, current, and high-cost scenarios
Scenario analysis is safer than a single number. The table below assumes 100kW capacity, 130,000kWh annual generation, and REC weight 1.0.
| Scenario | SMP | REC | Construction cost | Annual gross | Annual operating profit | Monthly operating profit | Simple payback |
|---|---|---|---|---|---|---|---|
| Conservative | 120 KRW/kWh | 65,000 KRW/REC | 160M KRW | about 24.05M KRW | about 20.55M KRW | about 1.71M KRW | about 7.8 years |
| Sep. 2026 current table | 162.74 KRW/kWh | 70,752 KRW/REC | 180M KRW | about 30.35M KRW | about 26.85M KRW | about 2.24M KRW | about 6.7 years |
| Higher construction cost | 162.74 KRW/kWh | 70,752 KRW/REC | 220M KRW | about 30.35M KRW | about 26.35M KRW | about 2.20M KRW | about 8.3 years |
| Optimistic | 175 KRW/kWh | 75,000 KRW/REC | 180M KRW | about 32.50M KRW | about 29.00M KRW | about 2.42M KRW | about 6.2 years |
Two things stand out. First, high SMP improves profitability quickly. Second, higher construction cost stretches payback even when market rates are good.
When reviewing a quote, do not look only at the price per kW. Check what is included in the total: permitting, supervision, structures, modules, inverters, combiner boxes, monitoring, fencing, CCTV, drainage, access road, and grid-related costs.
5. REC weight 1.0 versus 1.2
REC weight has a major effect. With 130MWh of annual generation, a 1.0 weight creates 130 RECs. A 1.2 weight creates 156 RECs.
Using the September 2026 REC figure of 70,752 KRW:
| REC weight | REC revenue | Annual gross | Annual operating profit | Monthly operating profit |
|---|---|---|---|---|
| 1.0 | about 9.20M KRW | about 30.35M KRW | about 26.85M KRW | about 2.24M KRW |
| 1.2 | about 11.04M KRW | about 32.19M KRW | about 28.69M KRW | about 2.39M KRW |
A 0.2 difference in REC weight changes monthly operating profit by roughly 150,000 KRW. That may look small, but over ten years it becomes meaningful.
REC weight depends on site, facility type, capacity, and policy conditions. A farmland project does not automatically receive a favorable weight. The exact rule should be checked with Korea Energy Agency, KPX, the installer, and the local government before investment.
6. For farmland solar, permits come before the revenue table
A farmland solar project can fail even when the calculation looks good. Farmland conversion, development permits, setback rules, village complaints, drainage, road access, and grid connection all matter. Whether the land is in an agricultural promotion zone is also critical.
Grid connection is the hidden bottleneck. Even if SMP and REC are attractive, the project stops if it cannot connect to the grid. Available connection capacity, cost sharing, and waiting time should be checked early.
A safer review order:
- Check land category and zoning.
- Check whether the land is in an agricultural promotion zone.
- Check local development-permit rules.
- Check setback rules from houses, roads, and village areas.
- Check KEPCO grid connection feasibility.
- Compare construction quotes and generation simulations.
- Calculate payback under multiple SMP and REC scenarios.
The revenue table is not the first step. Whether the land can actually host the project comes first.
7. Loans change the cash left in hand
The calculation above is before loan repayment. If a large share of the 180M KRW investment is financed by debt, monthly cash flow changes sharply.
For example, even if annual operating profit is 26.85M KRW, annual loan repayment of 15M KRW leaves about 11.85M KRW before tax and other costs. That is about 990,000 KRW per month. If annual loan repayment is 20M KRW, monthly cash drops to about 570,000 KRW.
Solar profitability should be read in three lines.
- Revenue: SMP revenue + REC revenue.
- Operating profit: revenue minus O&M.
- Real cash flow: operating profit minus loan repayment, tax, and rent.
Many “monthly profit” claims are closer to revenue or operating profit. The farmer’s bank account is the last line.
8. September 2026 conclusion
As of early September 2026, solar profitability looks reasonably strong. Applying mainland SMP of 162.74 KRW/kWh and REC of 70,752 KRW/REC to a 100kW system gives about 2.53 million KRW in monthly gross revenue and about 2.24 million KRW in monthly operating profit after basic O&M.
But that number rests on current market rates. SMP and REC move. Construction cost varies by site. If grid connection is blocked, the plant earns money only on paper.
A practical reading is this.
- If total 100kW investment is around 160M KRW and grid conditions are good, the project is worth reviewing seriously.
- At around 180M KRW, run downside scenarios for SMP and REC.
- Above 220M KRW, civil work and grid-cost assumptions must be conservative.
- If debt is high, calculate monthly cash flow before looking at monthly profit.
Solar can still make money. But the correct sentence is not “SMP is high, so it works.” It is “the land, construction cost, grid connection, and conservative price assumptions must all fit.” Run the calculator twice before signing.
References
- Korea Renewable Energy One-Stop portal, REC spot settlement information displayed on September 3, 2026: September 2026 mainland average 70,752 KRW/REC.
- Korea Renewable Energy One-Stop portal, SMP information displayed on September 3, 2026: mainland average 162.74 KRW/kWh.
- KPX EPSIS, mainland SMP weighted averages checked for September 1 to September 3, 2026.
- KPX and Korea Energy Agency RPS program materials: solar revenue should be read as SMP power-sales revenue plus REC revenue.
- This article uses an illustrative 100kW case with annual generation of 130,000kWh, REC weight 1.0, and annual O&M of 3.5M KRW. Actual results vary by generation, site, grid connection, construction cost, debt, tax, and REC weight.